

The growing market for digital assets is fighting aggressive regulation, leaving cryptocurrencies vulnerable to heavy losses. The macroeconomic environment has reached a critical point as volatility of various types threatens global markets and energy markets, prompting alarming behavior among institutional investors.
When many economies are facing a crisis at the same time, the top beta altcoin leaders will undoubtedly experience volatility. Ethereum (ETH) is currently caught in the crossfire, experiencing a major decline that puts its months-long market cap at a high risk.
Will Ethereum Crash Below $2,000?
For traders looking at the charts, the risk of Ethereum falling below $2,000 is very possible. Driven by the liquidation of the market, ETH has broken several long-term levels in the last week. Whether the stock falls below the $2,000 target will depend on the technical security of the existing horizontal support and how the global military escalation and corrections play out over the weekend.
What’s Happening with War?
Crypto crashes are rarely caused by a single technical problem; they are almost always the result of financial flight from risky assets due to major global events. Today, two major geopolitical factors are driving sales:
1. Risk of US-Iran Strike and Risk of Rising Currency
According to reports from CBS StoryThe United States is investing its resources to counter Iran. This has severely disrupted commercial traffic through the vital Strait of Hormuz. The threat of escalating tensions has pushed up oil prices, fueling fears of inflation in the consumer price index (CPI). As a result, expectations of the Federal Reserve’s interest rate cuts have faded, forcing investors to buy prices in the long-term that generate cash in crypto markets.
2. Large-scale Deployment of Chinese Military Forces Near Taiwan
Adding to the pressure on international markets, Taiwan’s National Security Council Director Joseph Wu confirmed that China has sent more than 100 naval, coast guard, and military vessels through territorial waters from the Yellow Sea to the South China Sea and the Western Pacific. This aggressive preparation follows a major meeting in Beijing between US President Donald Trump and Chinese President Xi Jinping, where the “Taiwan crisis” began.
Adding to the concern, the U.S. Army has officially suspended a $14 billion arms sale to Taiwan to keep arms in the burgeoning Middle East war. This leaves the self-governing island in the open. A Chinese military blockade or an attack on Taiwan threatens the heart of the global semiconductor chain, forcing global markets into defensive panic and accelerating economic outflows from other sectors such as. Ethereum.
Ethereum Price Prediction: Will ETH Coin Crash?
A closer look at the ETH/USD daily chart shows the trend of the market that has been bullish for the entire month.
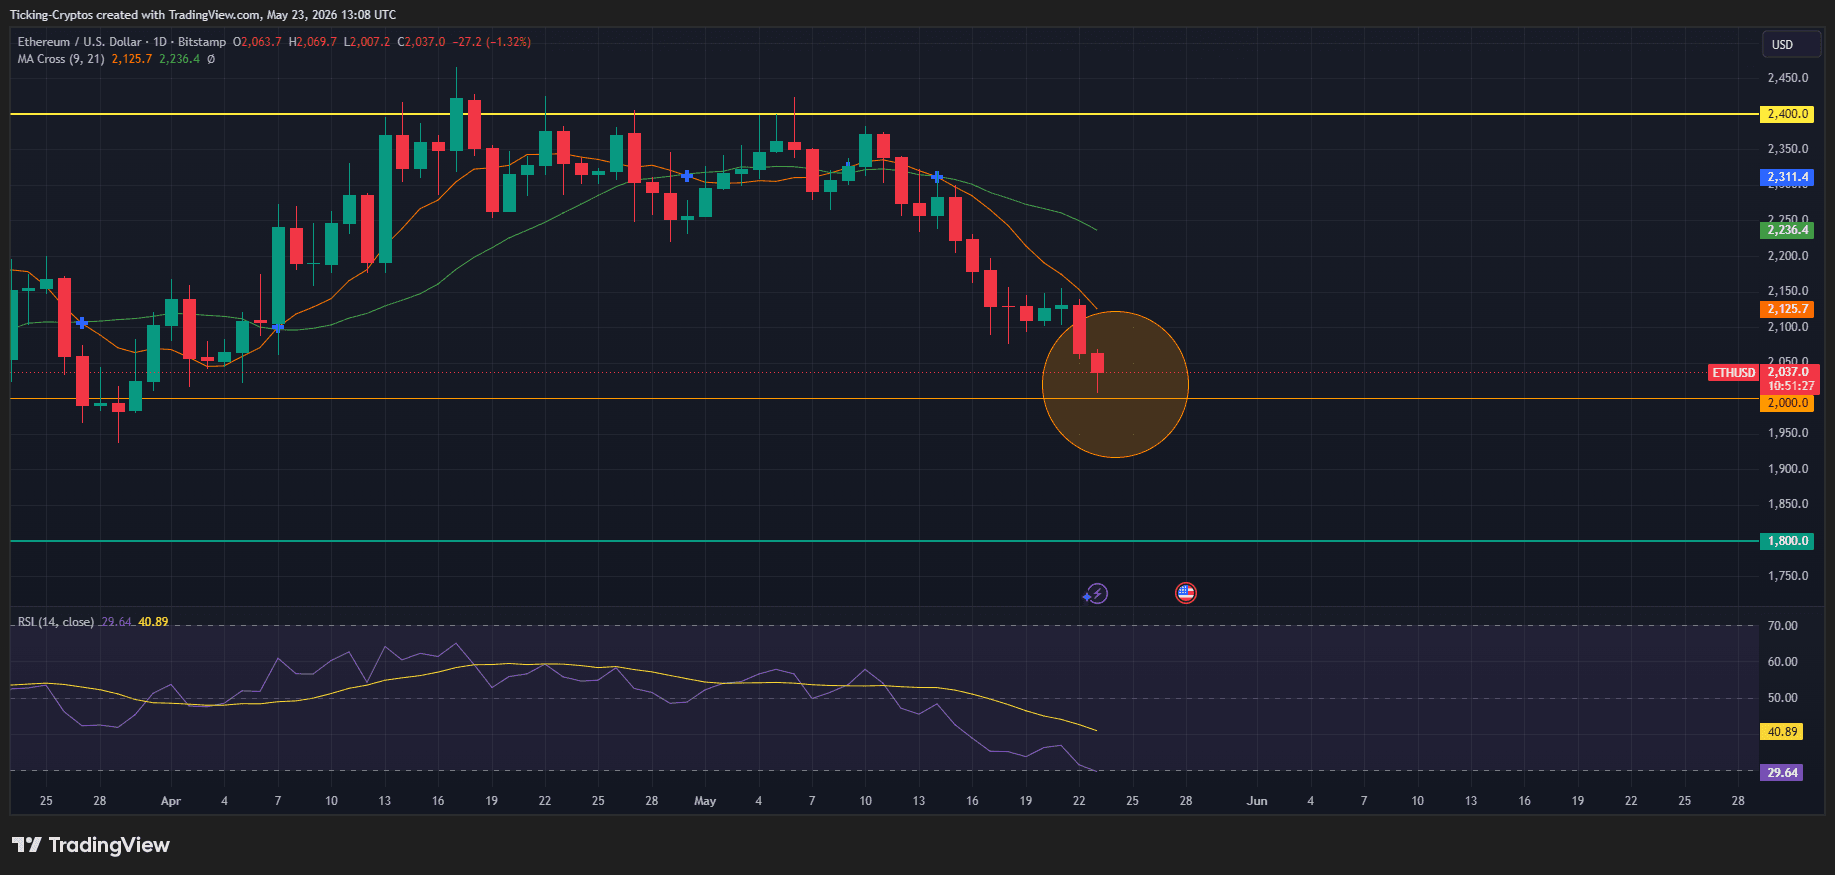
- Moving Average Cross Failure: The daily candles show clear resistance from the 9-day and 21-day Moving Averages ($2,125 and $2,236 respectively). A fast cross that passes under the tracker slowly has become a strong resistance, and every attempt at a support group.
- The Highlighted Drop Zone: As highlighted by the yellow display on the chart, Ethereum has published consecutive, large red candles on a daily basis. This selling pressure has caused the stock to drop to the current price of $2,037.
- Summary of RSI: The Relative Strength Index (RSI) has entered a very strong trading position, which is subscribing to 29.64. Even if the RSI overshoot indicates that a short-term reversal is in order, in the case of a large selloff, it can remain bearish as the price continues to decline to the initial financial waters.
Traders looking to manage this volatility and financial lock-in can compare the best trading platforms using our crypto exchange comparison.
Two Possible Trends in Ethereum Markets
With the price rising above the critical emotional zone, the market is facing two different directions in the coming days.
Example 1: Bearish Breakdown Below $2,000
If economic or political triggers increase, such as the appearance of Iranian military aggression or a naval attack on Taiwan, the crypto market will also experience another independent wave.
In this example, the horizontal support line is right there $2,000 it will break. Considering the lack of a large order below $2,000, a breach of this level can lead to suspension and panic selling. This can quickly bring the price down to try the main support line that appears $1,800 (which has a green line on the chart), represents an 11% drop from the psychological limit.
Issue 2: Jump Oversold Support and Update
Conversely, if geopolitical tensions ease, the Strait of Hormuz is reopened, and China expands its military base, technology tends to be firmly anchored by bulls.
The $2,000 level is the starting point. Because the RSI has already started to hover in the oversold zone ($29.64), the selling pressure can end immediately. A successful defense of the $2,000 support would lead to an aggressive squeeze, pushing Ethereum to recover. $2,125 dealing with a downward spiral by next week.
Strategic Overview and Key Takeaways
| Metric / Level | Current Price / Zone | Market Demand |
|---|---|---|
| The price of ETH shares | $2,037 | Travel only 1.8% above the most important point. |
| Recent Support | $2,000 | Line of thought; the spare parts go down to $1,800. |
| Strong Resistance | $2,125 – $2,236 | The correlation of the 9-day and 21-day Moving A averages. |
| Basic Global Risks | Iran / Taiwan Strait | Threats of conflict between two theaters costing a lot of money. |
As the market goes through this volatility, protecting your position against platform risk is important. Reviewing cold storage using our hardware wallets is still an accepted practice for risk management during a market crash.


