

Ethereum ($ETH) has officially broken below the much-watched $2,000 level. As the growing digital economy faces pressure to resell, the second largest cryptocurrency by market capitalization is struggling to find a stable foothold.
While the recent drop below $2,000 represents a strong short-term hit, historical charts show that the bottom is a very strong one waiting for a drop. Traders are now shifting their focus to the $1,800 level as the next defensive level for buyers.
Technical Breakdown: Weekly Chart Analysis with ETH/USD
According to the ETH/USD weekly chart, Ethereum has entered a familiar minor bearish zone following several weeks of resistance from higher levels.
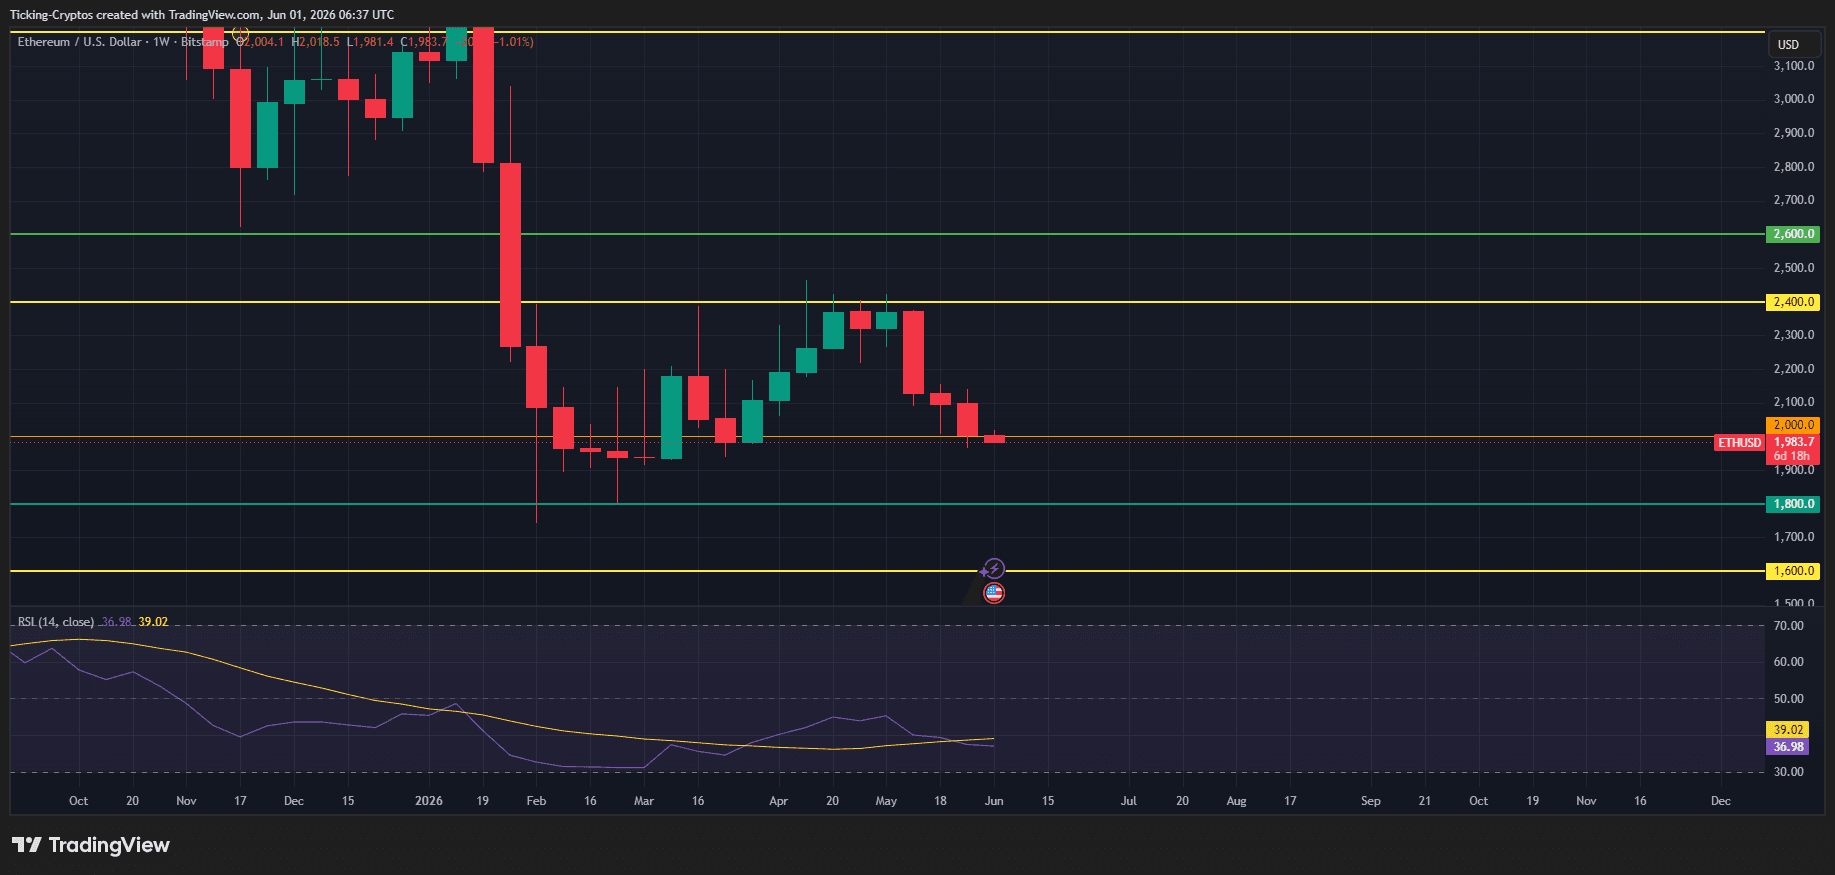
1. Fall of the $2,000 Pivot Zone
The price level of $2,000 is above the horizontal support line; it acts as an anchor for market sentiment. After spending the first part of the year consolidating above this area, the latest candlestick for the week shows a continuation of the bearish trend. The price is going around here $1,983.70turning the previous orange support band into a resistance line above it.
2. Why $1,800 Stands as a Strong Bottom
If the sale continues, the next target is $1,800 (identified by the green support line on the chart).
- Previous Validation: This region served as an important part of the market disruption in late 2025 and early 2026.
- Number of Blocks: In contrast to the decline in losses from $2,400, the $1,800 zone contains a large group of buyers’ interest, making it a strong wall for the bears to break through.
3. Relative Strength Index (RSI) Deepens in Bearish Territory
The 14-period Relative Strength Index (RSI) on a weekly basis is published here. 36.98below its yellow moving line of 39.02. Because the RSI is moving lower to the oversold 30 level without showing any signs of change in momentum, the indicator remains a bearish indicator.
Macro Context and Market Sentiment
The broader crypto landscape reflects this caution. While major developments such as the recent Spot Exchange-Traded Fund (ETF) movement provide support for the digital financial community in the long term, long-term economic challenges are making it difficult for investments to be properly distributed.
According to market updates, the volume of the crypto space has decreased, allowing the derivatives shorts to be very rich in the underlying prices. About Ethereum to break this trend, the bulls must return to the level of $ 2,000 every week and push back. $2,400 main opposition line. Failure to do so opens the door wide for you to try lower-cost areas.
The Next Bearish Target
If sales continue to increase and the $1,800 housing support fails, the main chart will show a target nearby. $1,600 (indicated by the bottom line of the yellow border). However, given the depth of buy orders that are usually around $1,800, a drop to $1,600 remains a rare issue unless it triggers a corporate withdrawal.
Traders should closely monitor the daily close to the $1,980 area to determine whether this damage is a short-term sweep or a definite drop in the deep blocks.


