

Bitcoin’s rally over the weekend is facing a familiar problem: several TradingView analysts still see the move as a retest rather than a reversal.
TL; DR
- TradingView’s three opinions point to Bitcoin struggling with key resistance after the recent crash.
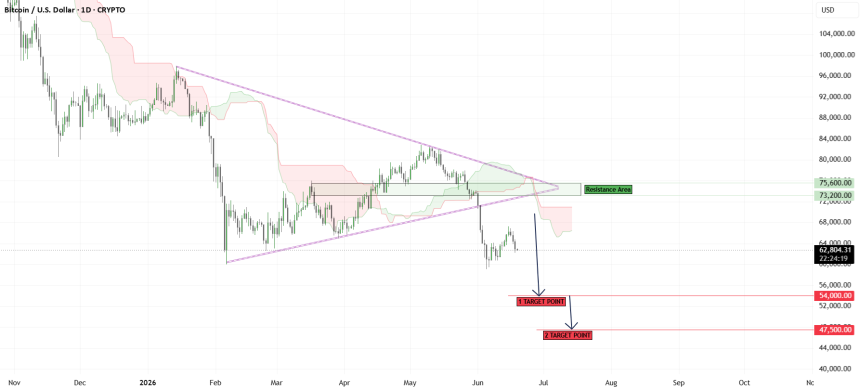
- SHAY_ANALYTICS says BTC remains bearish as it trades under the support of the old triangle and Ichimoku cloud.
- Milad_sangari shows a breakdown of the channel and retests near the $63,600–$63,980 resistance area.
- DomicChaina says the $64,000–$65,000 range will remain a key ceiling unless buyers show strong follow-through.
Bitcoin’s Rebound Has Met the Test of Criticism
The common thread in the bearish TradingView setup is not the same Bitcoin it should fall immediately. It’s just that the latest blowout hasn’t done enough to convince retailers to lose steam.
In one of the more conservative opinions, TradingView analyst SHAY_ANALYTICS explained that BTCUSD has confirmed a bearish breakout from the triangle triangle. The analyst said that the price is still below the previous support area and below the Ichimoku cloud, leaving a bearish bias unless the buyers recover the broken pattern.
This setup creates a long-term resistance near $73,200 and a high resistance near $75,600, while the lower targets are $54,000 and $47,500. The key point is the design: old support is now seen as resistance, and rallies in this area can attract new sales only when Bitcoin closes above it with faith.
Short Term Investors View $63,600–$65,000
The second TradingView opinion from Milad_sangari focuses on the BTCUSDT short term. The analyst said that Bitcoin broke below the hourly rising trend line and retested previous support as resistance.
The area of resistance shown in the analysis is $63,600-$63,980, an area that the analyst said also corresponds to key Fibonacci levels. This makes the current position important to traders trying to separate a healthy rebound from a failed retest.
DomicChaina gave a similar reading on the four-hour order, arguing that Bitcoin’s recovery around $63,500 remains below the EMA band around $64,050–$64,970. In this view, BTC can still push a little higher to $64,000-$65,000, but this area can be a selling point if buying lower.
The Bearish Case Is Important
A bearish setup is not calling at all or not at all. They are standard market maps. If Bitcoin recovers key areas and holds above them, the bearish sentiment quickly weakens. But until that happens, the chart remains vulnerable to further moves.
This leaves traders looking to see if the weekly recovery can turn into a sustained recovery. A failed move near $64,000-$65,000 would put pressure on the lower supports. A clean break above the zone can force the shorts to look again and can open the door to a strong move.
For now, the message from these tech experts is straightforward: Bitcoin has taken a hit, but the recovery needs to prove itself.
This article was written by News Desk and edited by Samuel Rae.



